Timeline
The Timeline shows all the individual of the genealogy along a timeline of events that occurred in different countries.
Individuals can be displayed as a genealogical tree.
Description
This view displays a menu bar, a timeline frieze and the individuals' events.
The timeline
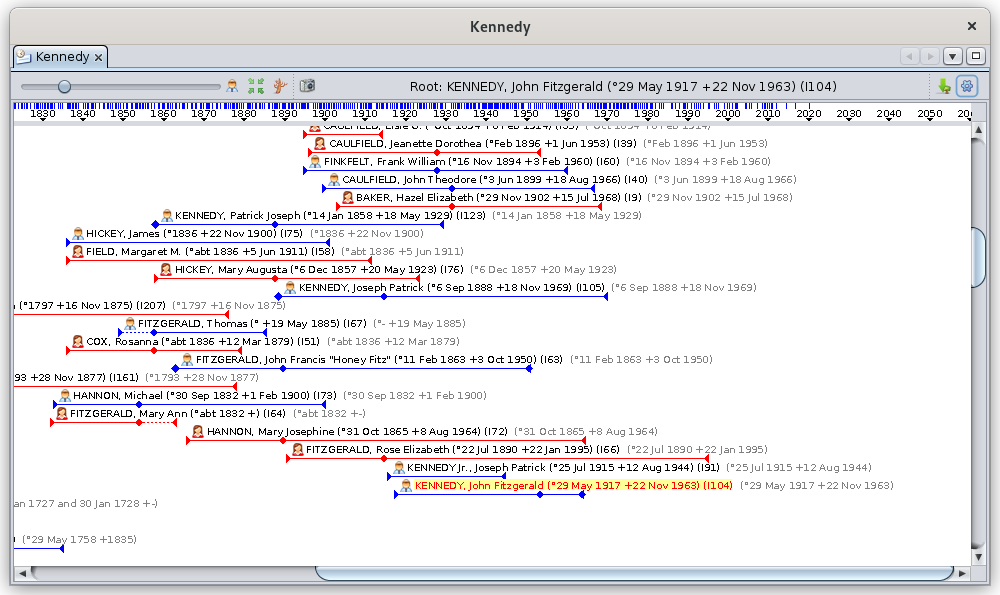
The timeline looks like the following:

- The timeline lists the years and for each of them, marks its exact time with a grey cursor.
- The timeline also displays blue markers: these are important events that occurred in the countries of the Ancestris' almanacs.
Below the timeline, the view offers two modes of displaying events over time.
- Individual mode: events are grouped within individuals' lifespans, these being arranged in a horizontal genealogical tree: the ancestors on the left, the descendants on the right.
- Event mode: events are listed in bulk from the oldest to the newest, and packed vertically to take up the least amount of space possible.
Individual mode
All individuals in the genealogy are displayed, which is not the case for the Dynamic Tree view.
For each individual, the sequence Birth, Marriage, and Death are displayed.
The other events are not displayed.
Individuals are listed in a genealogical order.
Representation of an individual
In the following picture, we see 4 individuals :
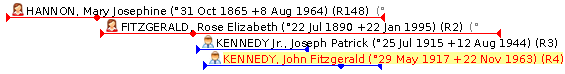
Women are represented by a red line, men by a blue line. If the gender is unknown, the line is grey.
- The line begins on the left with a small triangle marking birth, then follows a diamond marking marriage, and finally an end triangle indicating death.
- If dates are unknown, an approximation is used and the line is dotted over the uncertain period.
Above the line is the individual's icon and full name.
The individual in yellow is the selected individual in Ancestris.
Order of Individuals
Individuals are listed one below the other in chronological order of births and in genealogical order.
This representation of a timeline is an Ancestris invention. It is a genealogical timeline-tree.
As the set of individuals is displayed, you will find individuals from the same family as well as individuals from more distant branches.
Ancestris therefore lists the individuals in order of births, and for each individual, scrolls through all the branches of his/her descendants, then moves on to the next individual in the births.
If the next individual is part of another tree, a line is skipped.
The descending branches of each individual's tree are traversed by the descendants in chronological order. As soon as the youngest descendant is reached, the display resumes from the next siblings. As soon as all siblings have been displayed, the display goes back to the siblings of the parent already displayed, then the spouse, descendants, siblings, etc.
This implies that:
- below an individual is usually his/her descendants or siblings in the descending direction (to the right), or his uncles and aunts or other relative in the ascending direction (to the left)
- if there is a line break, it means that we skip to another tree
- two spouses of the same couple are therefore separated by all their common descendants
Event mode
All the events of the genealogy are displayed.

For each event a diamond is displayed showing the date of the event, the icon of the type of event and the name of the individual to whom the event relates.
The events are listed in chronological order vertically. As soon as there is enough space to display another event to the right of an event already displayed, a column starts again. This results in the following type of display:
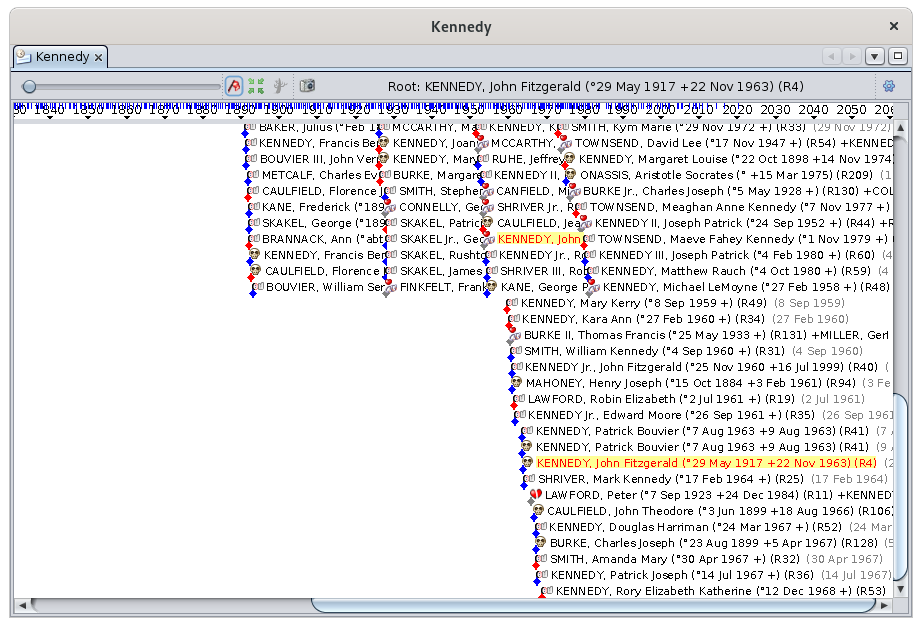
Of course, it's a bit "cramped". You will then understand the usefulness of the Zoom slider, which allows you to stretch the timeline and put a little space between each event.
Toolbar

The toolbar presents the following tools :
Zoom slider
The zoom slider allows you to change the zoom level of the display area:
- Towards the left, the display moves backwards: more individuals or events are seen in the display area.
- To the right, the display moves forward: we see fewer individuals or events but the information is more readable and likely to display more information.
Hovering over this cursor displays a tooltip giving the scale of the current area in number of centimeters per year.
With this slider, the user can instantly adjust the scale of the display area.
Display Mode Button
This button toggles between the two display modes :
 Individual mode: toggles the display to individual mode
 Event mode: toggles the display to event mode


Center the tree Button
This button moves the tree in order to display the selected entity in the middle of the display area.
Change root individual Button
The structure of the displayed tree can completely change.
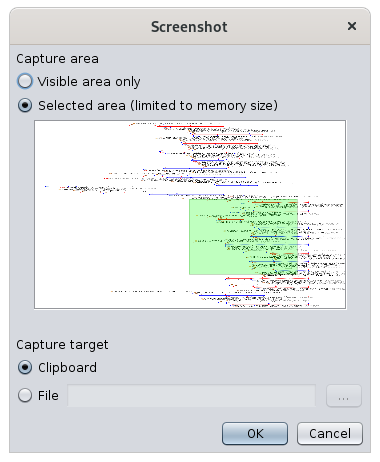
Screenshot Button
In the example below, the captured area will be the green area, and it will be put on the clipboard. This green area can be moved and edited with the mouse (drag or stretch lower right corner).
Name of the root individual Button
This part of the toolbar displays the current name of the root individual, whether the mode displayed is individual or event.
Export visible individuals into a new Gedcom file button
It is therefore possible to export visible individuals to a file that can then be sent to another person.
This can also be achieved using the "File/Save as" menu.
Configure view Button
This button displays the customization window. Its use is described in the Customization section.
Usage
The Timeline view is used to compare the life periods of individuals in relation to each other and in relation to historical events happening in the countries where they lived.
Navigation and selection
To move around in the display, simply click and drag the mouse over the display area or use the scroll bars of the window.
To select an individual, simply click on it, it then appears in the other views of Ancestris and becomes the selected individual.
This view can be used in combination with the Dynamic tree view. If you want to rebuild the dynamic tree with a new root individual, just double-click on an individual in the Chronological view and it becomes the root individual of the Dynamic tree view.
It is possible to choose the events to display or to add a grid in the display area for a better identification. See the customization section.
Display of the almanac
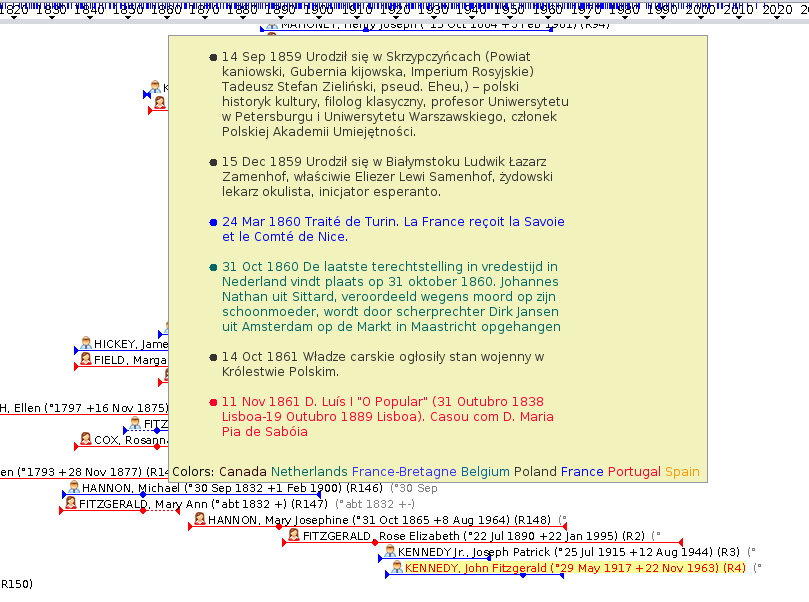
To display the important events that have taken place during the life of an individual in the history of his country, simply hover over the blue markers of the chronological frieze. A window appears listing the most important events recorded by Ancestris in the language of their country.
Here is an example where the mouse hovers over the marker of the year 1917. The popup displays the different historical events in the almanacs selected by the user in personalised colors.
Customizing the display area and the almanacs is described in the next section.
Almanac Utility
There is also an Almanac utility available from the menu bar Tools > Lists and Reports > List > List of Almanac events.
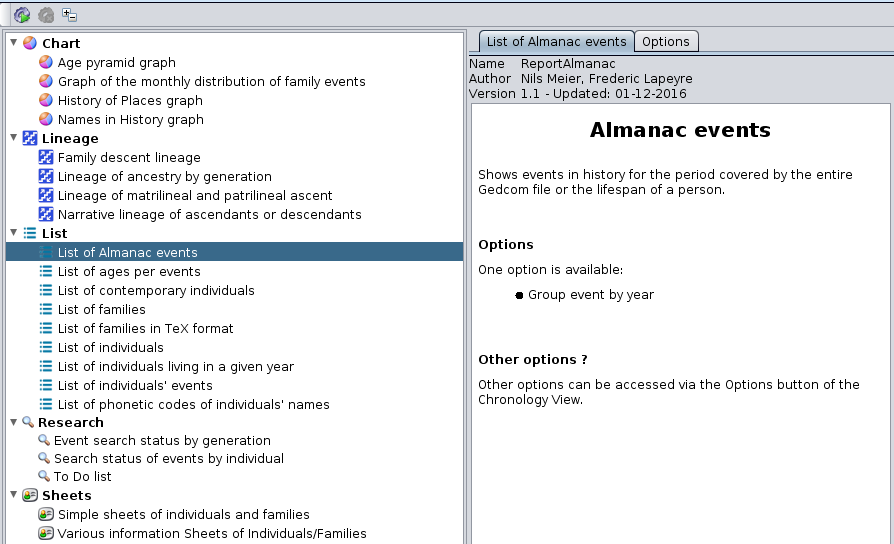
The output of this report is a text file to be saved. An option offers to have the results grouped by years.
If you launch this report from the menu, the result will contain all the events between the two extreme dates of the genealogy.
If you launch this report with a right click on an individual, from the context menu, the result will contain all the events between the birth and death dates of this individual.
Customization
It is possible to customize the display area, the almanacs and the colors.
Choice of events and display settings
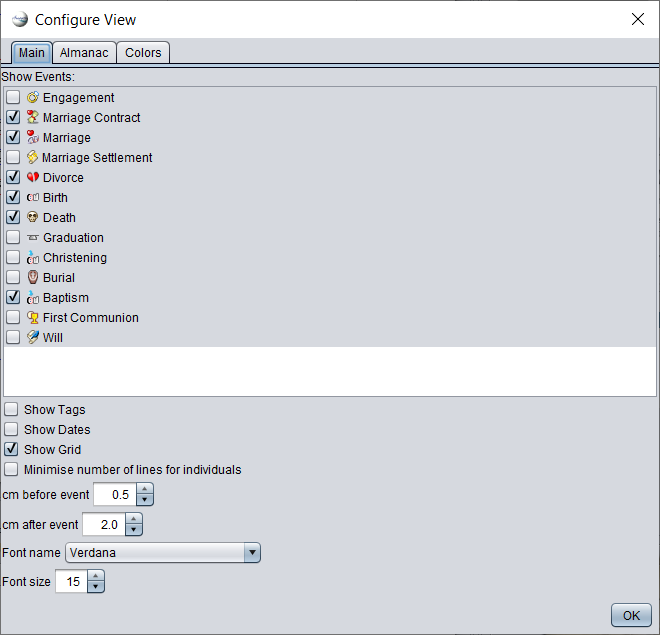
This tab allows you to choose the events to be displayed in the two display modes knowing that only birth, marriage and death are possible for the Individual mode.
It also allows you to choose other aesthetic or practical parameters to improve the visibility according to your needs.
Choice of almanacs

The left column allows you to select the almanacs to be used in Ancestris, including the Almanac utility. The "All" checkbox selects them all at once.
The right column allows you to select the categories of events to remember, among the selected almanacs. The checkbox "All" selects them all at once.
The number below on the right is the level of importance of the events to be selected.
- 0: Only the most important events will be visible.
- 9: all events will be visible
The files are placed in the User Directory. When they are deleted, they are permanently deleted.
Creation of an almanac
It is possible to create and add your own almanac.
To create your almanac, you will need to create a list of events for a given country.
There is a certain format to be respected so that Ancestris can read the list of events.
To respect this format, we suggest you use the spreadsheet fr-modele-almanach.ods which is an OpenOffice file.
This will help you to enter the events and create the file for Ancestris in the right format.
Once downloaded, open this file by activating the macros (guaranteed virus-free), follow all the instructions in sheet 1 "Parameter" to complete sheet 2 "Events".
Once completed, you click on the Validate button in the sheet and this will copy your data in text format to the clipboard.
The text looks like this :
1110;;fr;;;4;a;fr=Le sarrasin est ramené d'orient par les croisés. On appellera cette plante aussi, improprement, blé noir (biéna);;;;
1636;;fr;;;4;a;fr=L'évêque de Rennes, Pierre CORNULIER, possède dans son jardin de son manoir de Saint-Armel en Bruz, 15 variétés de poiriers. On peut penser que parmi celles-ci figure la variété Bon Chrétien, obtenue dès le XV° siècle;;;;
1649;1652;fr;;;3;a,h,g;fr=Mauvaise récolte de grains. Disettes et épidémies. La population rurale diminue.;;;;
Paste this text in a file you will call country.name.almanac where country is a two letter code for the country corresponding to your almanac (it can be England, so "en" for England), name is a specific name you give to your almanac, and 'almanac' must stay written like that. For example, you can call it en.my.almanac.
Then open the almanac' tab in the settings, click on the Add an almanac button, use the file manager to select your almanac. It then appears in the list of almanacs that Ancestris can use.
You can define several description for the same language.
If you put TITLE: at the beginning of a short description, you can display an untruncated description in the individual time line report.
Choice of colors

This tab lets you choose the color of the almanacs and the color of all the elements in the timeline display area.
Four tabs are available to help you choose your colors in classic color modes.
Did you know that?
The Swatches mode allows you to choose a color according to a color palette.
The HSV model (Hue Saturation Value) is a computer color management system.
The HSL model (Hue Saturation Lightness) are the three parameters for describing a color in a psychological approach to this perception.
The RGB model (Red Green Blue) is the computer color coding system closest to the hardware.
The CMYK model (Cyan, Magenta, Yellow, Key) is a process of quadrichromy of printing making it possible to reproduce a broad range of colors starting from three elementary colors.