
Quilt matrix
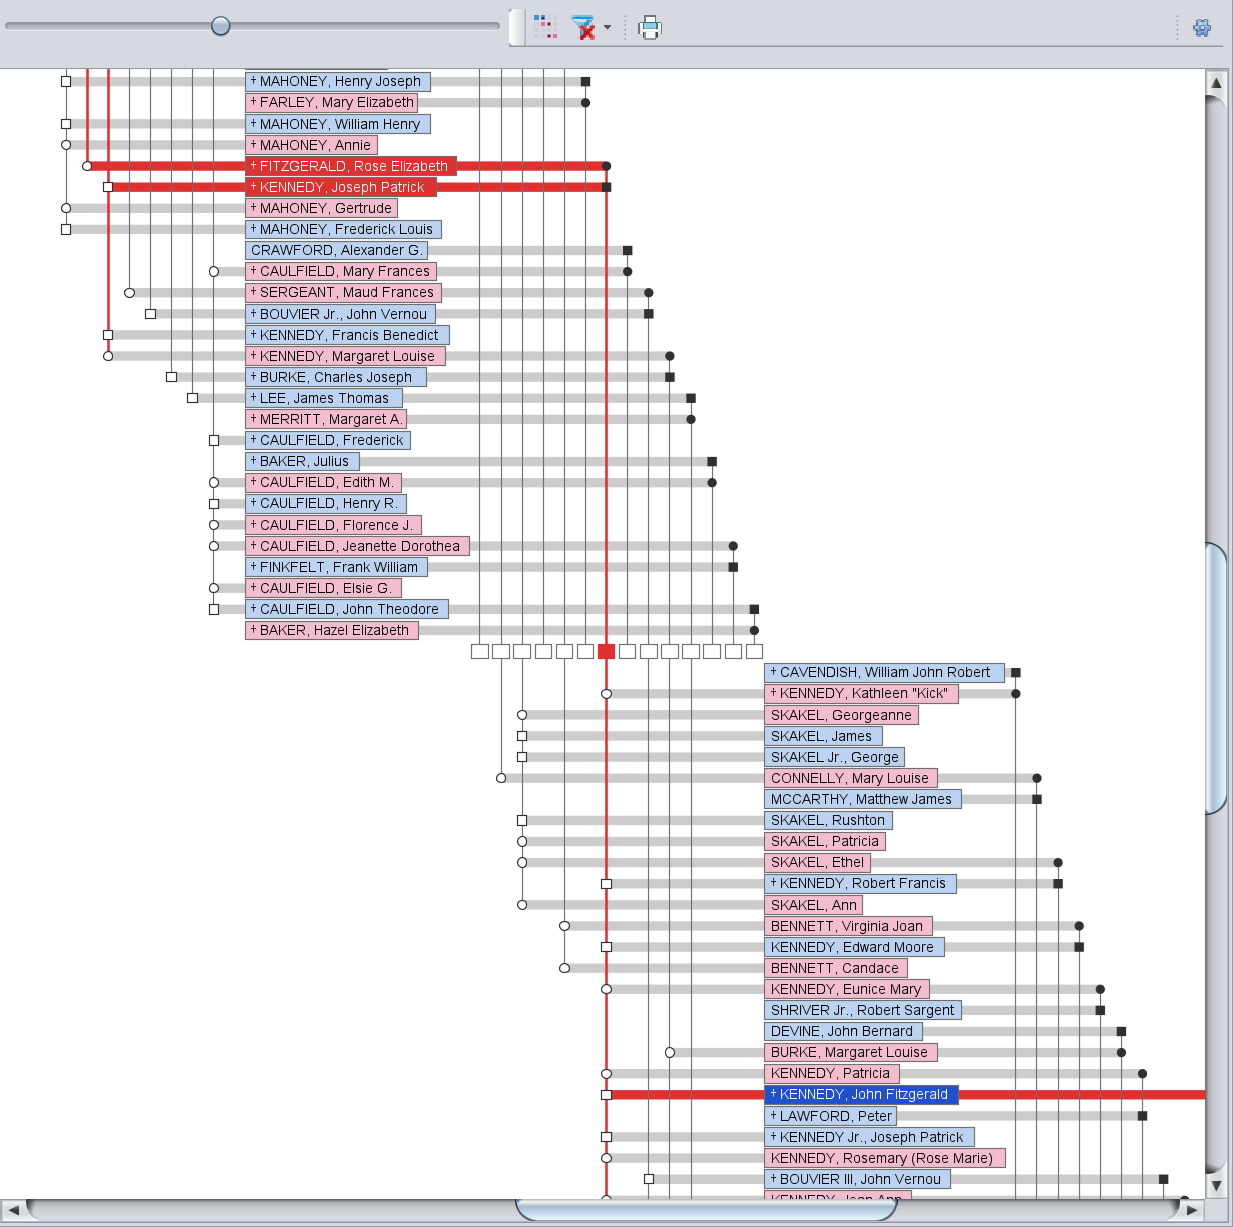
The Quilt matrix view allows you to view the entire family tree in the form of a diagonal matrix.
Each individual and each family appears only once, making it possible to view multiple marriages and implexes.
This display is inspired by GeneaQuilts (https://www.aviz.fr/geneaquilts). This builds on the work of A. Bezerianos, P. Dragicevic, J.-D. Fekete, J. Bae, and B. Watson presented in the article “GeneaQuilts: A System for Exploring Large Genealogies.” In IEEE InfoVis '10: IEEE Transactions on Visualization and Computer Graphics, Oct. 2010, Salt Lake City, USA.
Description
This view displays your family tree diagram, and a toolbar allows you to customize the settings to your liking.
Each person is linked to the families in which they are a spouse on the right and the family in which they are a child on the left.
The vertical bars represent the families.
The diagram updates in real time as you make changes to the genealogical data in the editors and allows you to select individuals or families.
Toolbar

Zoom cursor
This slider lets you adjust the zoom level of the diagram display. Click and drag to zoom in or out.
The mouse wheel has the same effect.
Rebuild Button
Rebuilds the diagram based on the currently selected person
All group button
By default, only the selected person's family group is displayed.
By clicking this button, you can view all the family groups in the family tree.
Filter button
Multiple filters are available.
- Close relatives of the selected individual. This is the default selection.
- Ancestors of the selected individual
- Descendants of the selected individual
- Individuals from the advanced search results.
Print button
This button allows you to print the diagram by saving the matrix image in SVG format (a vector image format). Ancestris will then automatically open it in your SVG viewer. You can print it from that viewer.
Settings button
This button allows you to change the diagram's display preferences. See the “Customization” section below for more details.
Customization
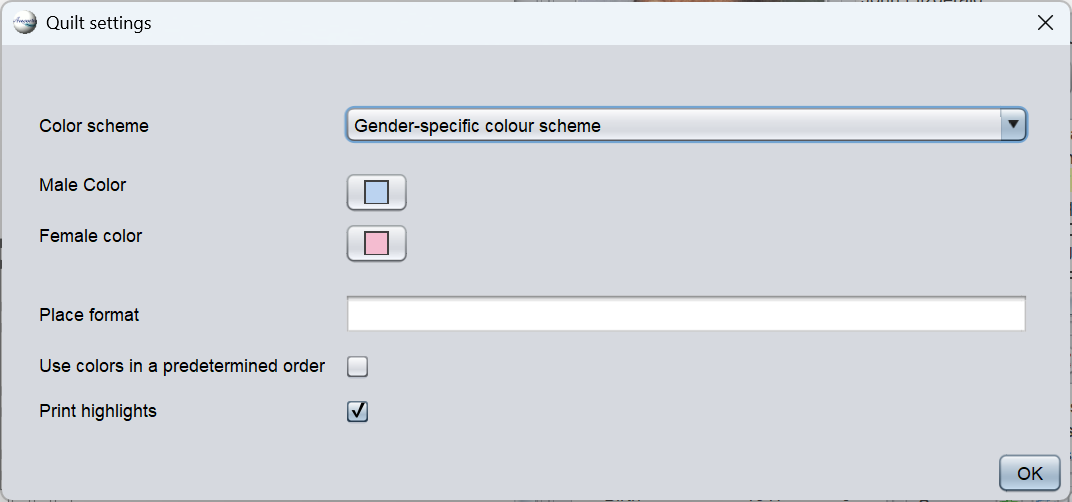
You can customize the diagram using the settings window, which you can open by clicking the Settings button in the Current View.
Layout Algorithm
Algorithms influence family trees with implexes that result in differences in the number of generations between branches. Typically, if a couple has two children whose descendants eventually marry each other—but in one branch in the third generation and in the other in the fourth—this dictates a placement strategy for traversing the entire tree in matrix form.
- Always align siblings on the same level: always try to place siblings in the same hierarchical layer as a priority.
- Always align spouses on the same level: always try to place spouses in the same hierarchical layer as a priority
Colorization Scheme
Allows you to change how individuals are colored.
You can choose from the following options:
- Black and white: no colored background for individuals
- Gender-based colors: uses the following two colors to color men and women
- Colors by profession: each individual is colored based on their profession; colors are chosen randomly or according to the “Use colors in a predetermined order” setting
- Colors by surname: Each person is colored based on their surname; colors are chosen randomly or according to the option “Use colors in a predetermined order”
- Colors by geographic region: Each person is colored based on the geographic region of their birth, or, if unknown, their death, or, if neither is known, their marriage; colors are chosen randomly or according to the option “Use colors in a predetermined order.”
Color for Men
Color selection for men in the gender-based color scheme.
Color for Women
Color choices for women in the gender-based color scheme.
Place format
Defining the format of locations for grouping colors in the geographic-area-based color-coding scheme
Use colors in a predetermined order
Uses a color list in an order that repeats from one iteration to the next.
Leaving this box unchecked uses colors in a random order for color schemes based on profession, name, or geographic region.
Export the highlighting
Add the current highlight to the SVG export.
Number of Ascending Generations
Specifies the number of generations of ancestors to display starting from the person around whom the chart was built.
This number is limited to 100.
Number of Descending Generations
Specifies the number of generations of descendants to display starting from the person around whom the chart was built.
This number is limited to 100.