Geographic map
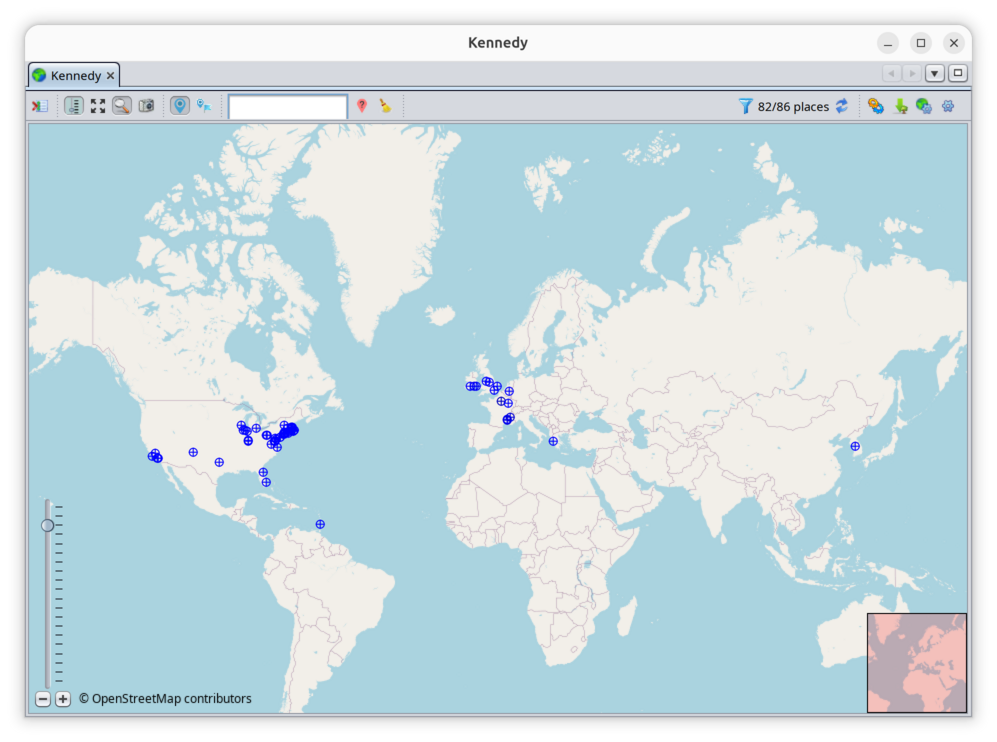
The Geographic map displays all the genealogy events at their location on a map.
You can visualize where the events you are interested in took place. In particular, you can apply filters to see only certain events and thus make geographical analyses of your population.
Description
The Map
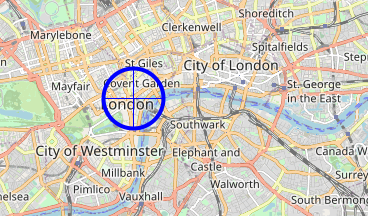
The map is an OpenStreetMap over which Ancestris plots the events. The blue dots represent places where the events of your genealogy took place.
Up close, a marker is a circle with a cross in the center. From a distance, it can be reduced to a point.
Two visual tools appear on the map:
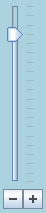
- the zoom slider at the bottom left with buttons
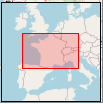
- the mini location map at the bottom right. The red frame represents the visible part in relation to a larger area of the main map.
Toolbar
A toolbar at the top allows you to modify the display and apply filters.

Display the list of places Button
This button opens the List of places view.
Show/Hide zoom Button
This button shows or hides the zoom slider.
Show all markers Button
This button adjusts the zoom level and centers the map so that you can see all the genealogy markers.
Show/Hide overview Button
This button shows or hides the mini card.
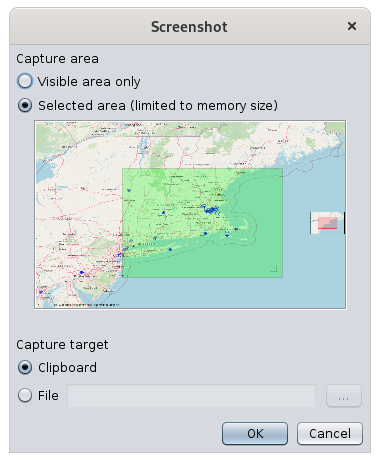
Screenshot Button
A screenshot window appears allowing you to choose a green area to capture, and to keep the image in the clipboard or in a file.
Show/Hide markers Button
This button shows or hides the markers.
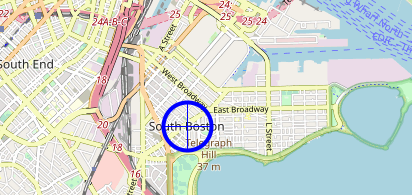
Toggle markers Button
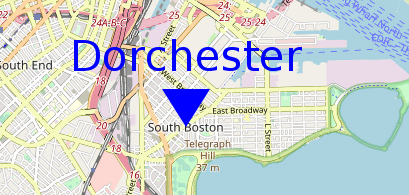
This button toggles between two marker display modes.
Marker in the form of a circle with the cross :
Marker in the form of a label with the city name :
Place filter field
This input field is a quick location filter. It allows you to display only those markers whose location includes the entered string.
To use it, type characters and then press the Enter key to apply the filter.
Clear the characters and press Enter again to remove this filter.
Show/Hide non-geolocated places Button
A non-geolocated place is a place with no known geographic coordinates.
It is placed by default off the coast of Bordeaux in the Atlantic Ocean.
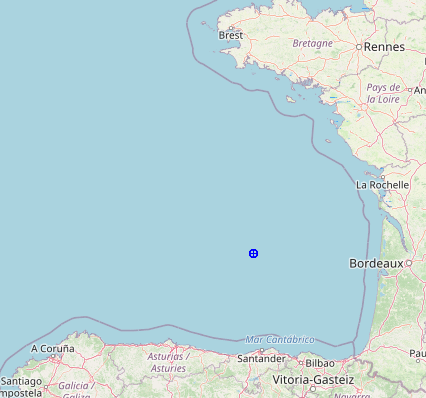
In order to alert the user that places cannot be located, and rather than placing them on land, which would not distinguish them from well-located places, we chose to place them in the sea!
Clear filters
Removes all filters and displays all places on the map.
Filter indicator 

This symbol tells you whether a filter is being applied or not.
A filter is being applied when at least one marker is not displayed.
Hovering over this symbol brings up a tooltip indicating which filter is in effect.
For example, here a filter is in effect to show only the markers for Joseph Kennedy's ancestors' events.

Next to the filter is displayed the number of places displayed out of the number of total places in the genealogy.
Refresh places from the Internet Button
This button triggers the search for places on the Internet. See the section Searching for coordinates of all locations for details.
Run reports
Run reports using the individuals involved in the displayed places.
Export visible individuals into a new Gedcom file button
It is therefore possible to export visible individuals to a file that can then be sent to another person.
This can also be achieved using the "File/Save as" menu.
Format places structure
Changes the structure of the place jurisdictions of the genealogy.
Configure view Button
The Geographic map is used to:
Navigate on the map
The map is moveable and zoomable, and can be moved by dragging the mouse with the mouse button pressed at any point on the map.
To recenter the map, double-click on the location to be placed in the center of the window.
The zoom level can be applied
- with the wheel of the mouse, if it remains above the map.
- by moving the slider cursor with the mouse,
- step by step by clicking on the
 buttons next to the slider,
 - or by clicking on the slider and using the up and down cursor keys.

Impact of the zoom change on the center of the map :
- When zooming with the scroll wheel, the geographic point under the mouse remains fixed.
- When zooming with the buttons, the center of the map remains fixed.
Identify events in a given location
From a place marked by a marker on the map, it is possible to identify the events that took place there.
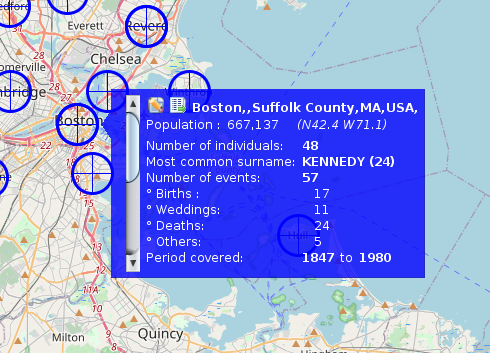
To do this, simply hover over the marker with the mouse. A small blue window appears like this one:
If several locations are very close, this window contains a vertical scroll bar on the left. By activating this scroll bar you can scroll through each of the locations in the area.
This window displays two buttons at the top followed by the full name of the place and the information about the place :
The window then displays the events that occurred there, a bit like a flash report :
- The number of individuals in relation to this place in your genealogy
- The most frequent lastnames in this place, and the number of times it is mentioned.
- The number of events that took place there, detailed below by type of event: births, marriages, deaths and others.
- The period in years covered by these events.
Update places
It is possible to update places in two complementary ways:
- By right-clicking on a point on the map, to identify surrounding locations or to capture the exact coordinates of a location using a location pop-up menu.
- By editing the place, using the place editor that opens from the blue window button described above.
Place pop-up menu
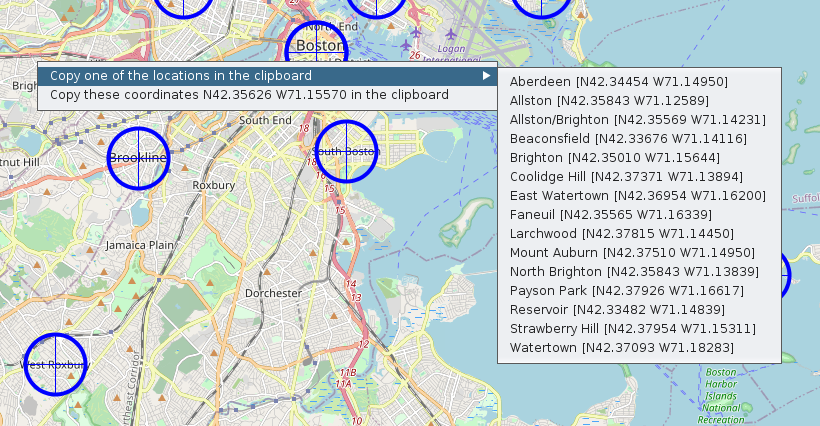
Two actions appear:
- Copy one of the locations to the clipboard: you can retrieve one of the places from the list in order to use it later.
- Copy the coordinates XXXXX YYYYY to the clipboard: this retrieves the exact coordinates of the place to use it later.
Place Editor
From the Edit this place button in the blue window above, you can edit a place.
See the Place Editor for more details.
Event Filters
One of the main interests of the map is to be able to apply filters to identify and analyze possible geographical relationships between individuals.
To apply filters, go to Configure View Settings. This window appears:
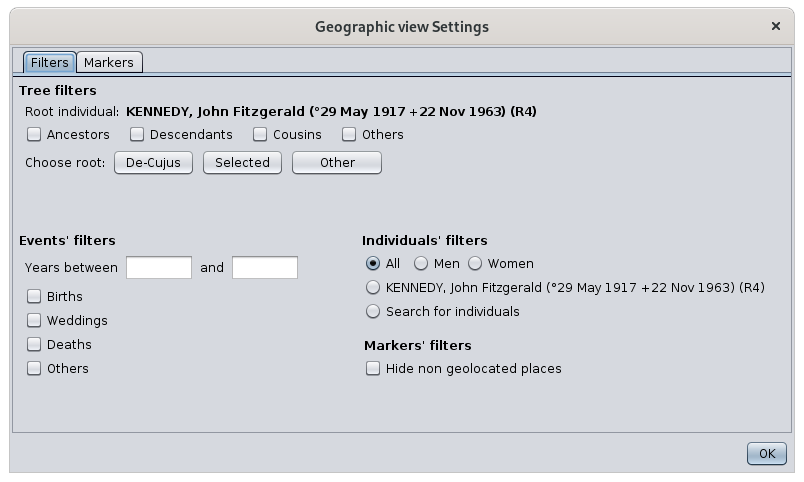
There are 4 groups of filters :
- Filters on the relationship of ascendancy or descent in a reference to a root individual which is defined only for this occasion.
- The checkboxes allow you to apply the filters. The corresponding groups of individuals will be included in the displayed markers
- Three buttons allow you to change the root individual directly if the current one doesn't suit you
- Its name is displayed above the check marks
- No numbering or data changes result from this choice of root individual
- Filters by type of event and by date of the event.
- This will display all events that correspond to the checkboxes and that fit within the period entered if any.
- Filters on individuals.
- Gender: only displays the event locations of individuals of the specified gender.
- Name of selected individual: displays only the places of the events of the selected individual whose name is displayed
- Search for individuals: displays only places with events of individuals from the advanced search
- Filter on the spot.
- Simple filter on non-geolocated locations
Any action on a filter in this window immediately updates the map.
Filters from different groups are combined with each other so that the displayed markers will have to match all conditions.
The use of filters is particularly interesting. It allows for example to answer the question: where are all the people of my genealogy whose occupation is a baker ?
To do this, simply search for all individuals with a baker occupation in the Advanced search window. Leaving this window open, go to the geographic filters above and check the "Search for individuals" box. The map will then display only the places that have had an event from a baker. You can also check the "Birth" box to have only the places of birth of the bakers.
Customization
It is possible to change the appearance of the markers :
- Their size
- Automatic adjustment of their size with the zoom level
- Their color
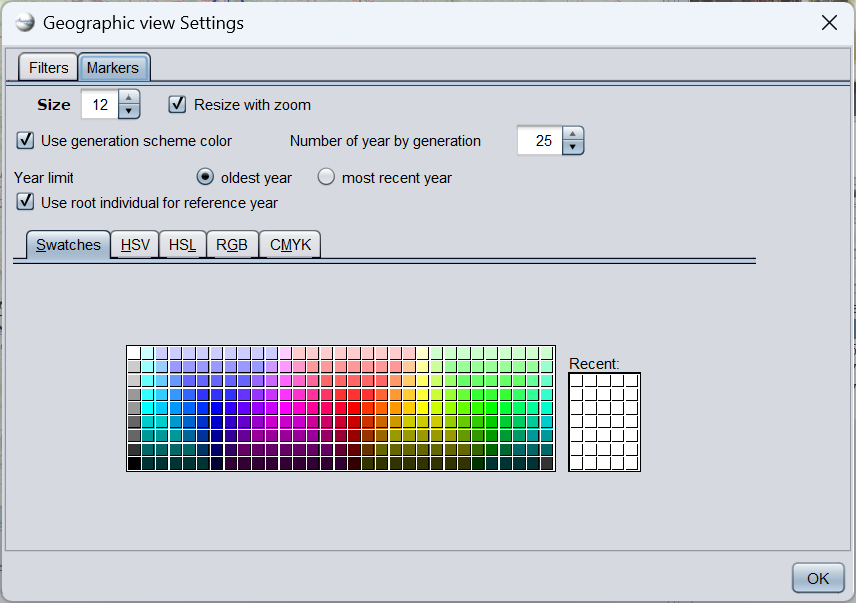
To do this, from the Configure View Settings, go to the Markers tab and make your choice of size and color.
By default, the size of the markers adjusts to the zoom level used.
- The closer the map is, the larger the markers are, as they are more easily visible and do not overlap each other.
- The further away the map is, the more markers there are and the more you need to reduce them in size. On the other hand, since the map gives less detail of the topology of the places, they are also more visible and therefore do not need to be as large.
If you do not want Ancestris to change the size of the markers, uncheck the "Resize to fit zoom" box.
Ancestris can use a color gradient to reflect the distance in time. The darker the color, the older the presence.
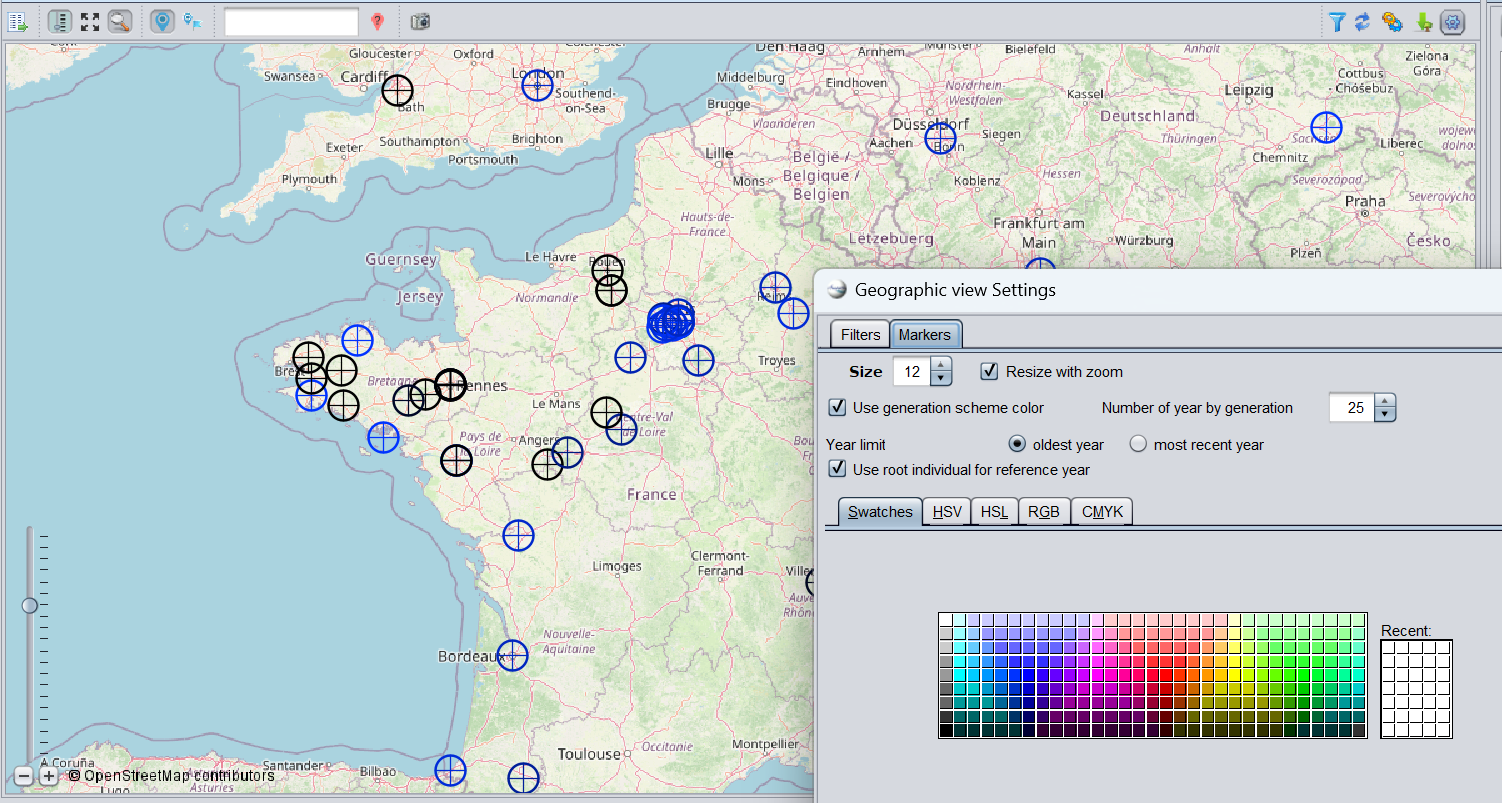
To do this, check the Use generation scheme color box.
In this mode, you can choose :
- Number of years by generation: duration between two color changes.
- Year limit: the year chosen for colorimetric information is either the oldest year of presence in the location, or the most recent year. For places whose presence is attested over several centuries, the color will vary.
- Use root individual for reference year: The reference year from which the gradient is calculated is taken from the date of birth of the root individual defined in the Filters tab of the map view settings. If no date of birth is available, the current year is used. If the box is unchecked, the current year is used.